Market sentiment

On this page you can stay ahead of the current stock market sentiment. If you want to dive a little deeper into the current market, you can read more in the articles below.

Volatility Index (VIX)

The Volatility Index (VIX) is an index that basically shows the sentiment of the market in the short term (next 30 days). On the interactive graph to the right, you’ll find the current image.

Many market participants use this volatility – i.e. how quickly prices change – as a way to interpret market sentiment. That’s why the index is also called the “fear index”.

More technically, the Chicago Board Options Exchange (CBOE) VIX represents the relative strength of the short-term price changes of the leading US S&P 500 index. It is based on S&P 500 options with short expiration dates and creates an estimate of the expected price fluctuations over the 30 days.

Fear & Greed index

Source: CNN Business

Another interesting resource for gauging market sentiment is CNN’s “Fear & Greed” index, which is also used by many market participants. Click on the image to the left to see the current index.

Too much greed continuously creates higher bids for stocks and a demand where “no price is too high”. When there is heightened fear in the market, an overweight wants to pull money out of the market – with the result that stock prices sink to a level they shouldn’t.

CNN uses 7 indicators to measure the level of fear and greed in the market, including market volatility (i.e. VIX), stock price momentum (S&P 500 versus the index’s 125-day moving average), and the ratio of put and call options.

You can see the current index here and read more about the specific indicators here

Guide to the Markets

Sunshine or rain? Guide To Markets Q3 2024

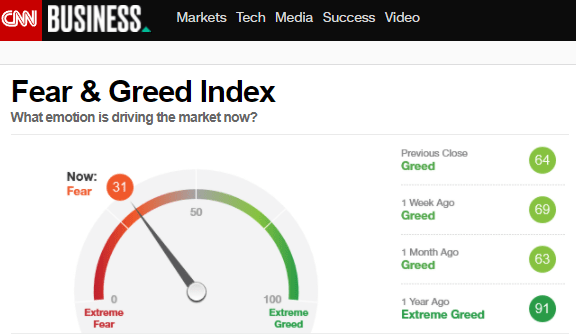
With many of us heading to the beach, it might be a time to lean back take a broad view of the global markets. To do so, we use three different indicators to measure the temperature and assess if markets are currently cheap or expensive.

Guide to markets Q1 2023

The stock market in 2023 The stock market has always had good and bad times. As much as we’d like to forget the bad ones

Guide to markets Q4 2021

At the end of October 2021, the US market (S&P 500) is back at an all-time high of almost 4,500, which is more than 30%

Guide to markets Q2 2021

The US market (S&P 500), here in April 2021, is at an all-time high of 4100 and significantly above the level when the Covid-19 pandemic