More than you know
Finding financial wisdom in unconventional places
Author : Michael J. MauboussinMichael J. Mauboussin
Published in: 2008 (updated 2013)
Buy the book here:
Saxo.com
Why should I read it? The book is a goldmine of practical tools to improve the way you make investment decisions.
The book is aimed at anyone who wants to broaden their horizons and get an introduction to the many disciplines relevant to investing.
About the author
Michael Mauboussin is Head of Consilient Research at Counterpoint Global and an adjunct professor at Columbia Business School.
Mauboussin was for many years chief strategist at Credit Suisse and then chief investment strategist at hedge fund Legg Mason Capital Management, where he worked closely with legendary investor Bill Miller.
A toolbox full of models
The book fundamentally seeks to answer the question: How best to solve complex problems in an ever-changing world?
The book offers a range of tools to make better decisions and increase the reader’s understanding of investment and risk. The focus is on the multidisciplinary. Mauboussin’s point here is that to the person with a hammer, every problem looks like a nail.
Instead, Mouboussin gives us an insight into his extremely well-equipped toolbox. He covers both classic investment topics with references to Buffett and Graham and takes the reader on a wide range of topics such as casino gambling, psychology, horse racing and evolutionary biology.
Below you’ll find three of the most interesting models in the book.
Process versus outcome
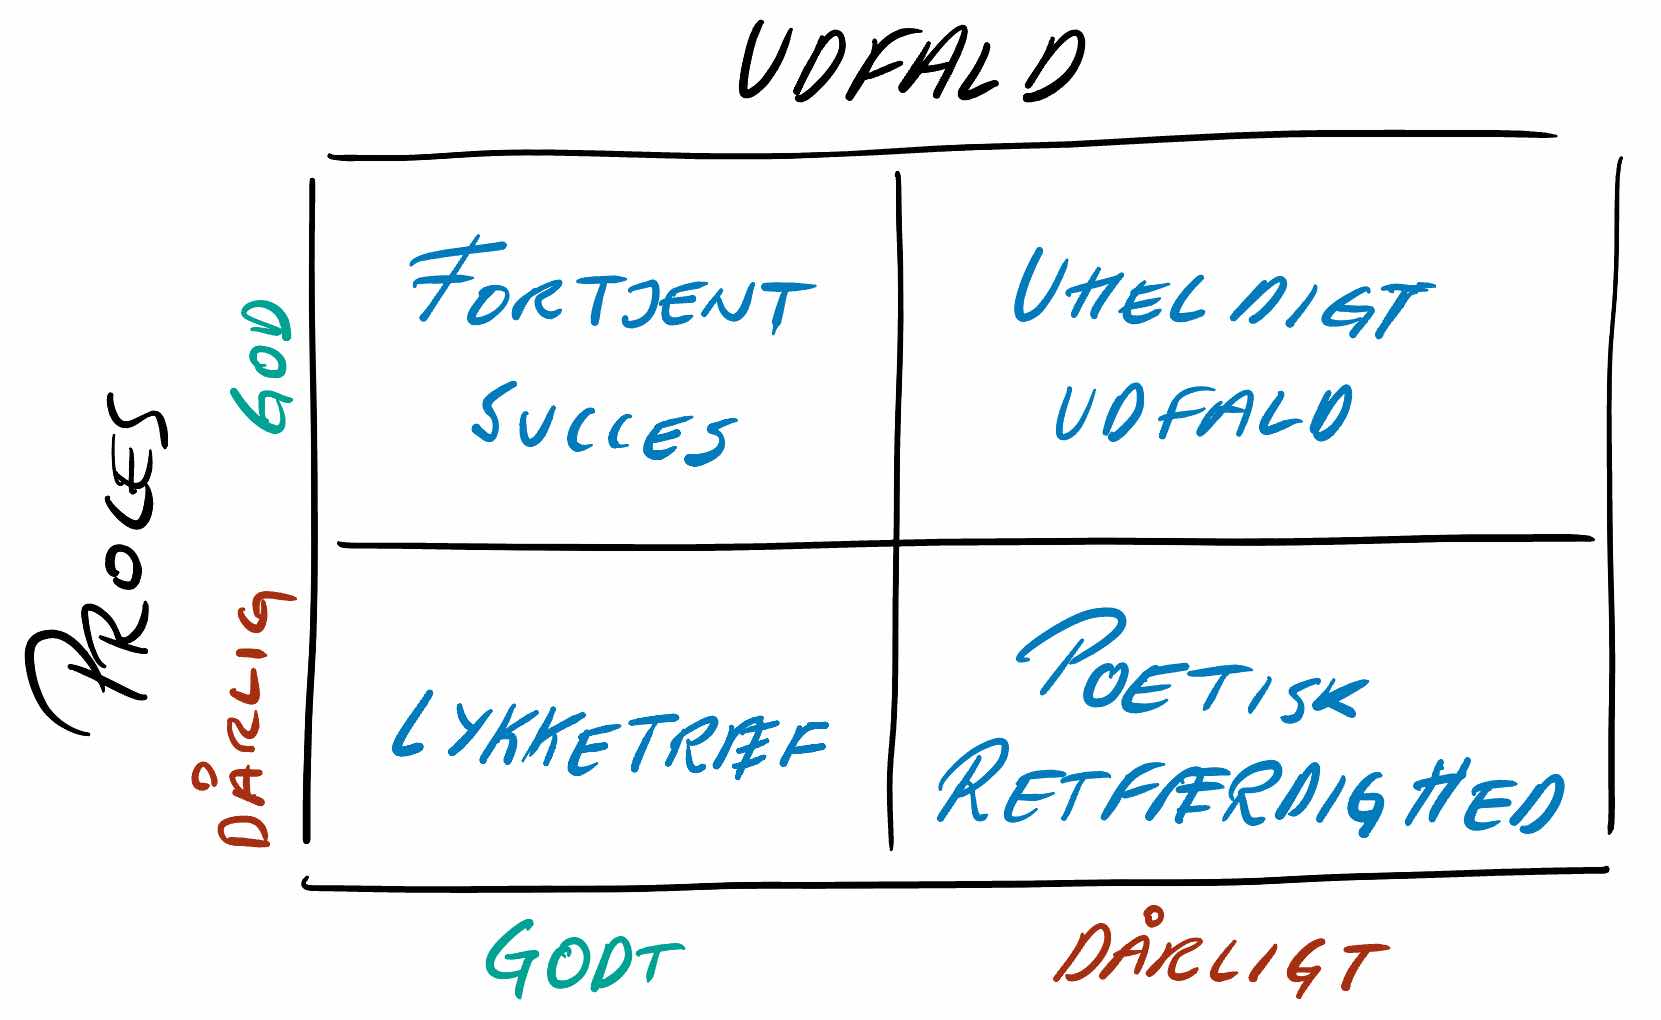
One of the most fundamental concepts in investing is the ability to distinguish between process and outcome. As investors, we tend to focus solely on the outcome of our investments and rarely dwell much on how we arrived at the decision.
It’s only natural, after all, what counts is the result, and that’s a lot easier to measure (what have we earned) than the quality of our decision. The problem, however, is that we often fall into the fallacy that a bad outcome is the result of a bad process.
In contrast, the most successful investors, sports managers and casino gamblers are focused on process over outcome. In the real world, theoutcome in the long run isdominated by the quality of your process, not the other way around. It can be illustrated like this:
The core of any investment process
What is the purpose of an investment process? According to Mauboussin, identifying gaps between a company’s share price and its ‘expected value’ in the future is – and here I agree – identifying gaps.
One of the biggest mistakes in the investment world is the inability to distinguish between knowledge of a company’s fundamentals and the market expectation that is implied and factored into the share price. Here he quotes Steven Crist, one of the most successful horse racing gamblers in history:
The issue is not which horse in the race is the most likely winner, but which horse or horses are offering odds that exceed their actual chances of victory […]. Under this mindset, everything but the odds fades from view. There is no such thing as “liking” a horse to win a race, only an attractive discrepancy between his chances and his price.
– Steven Crist
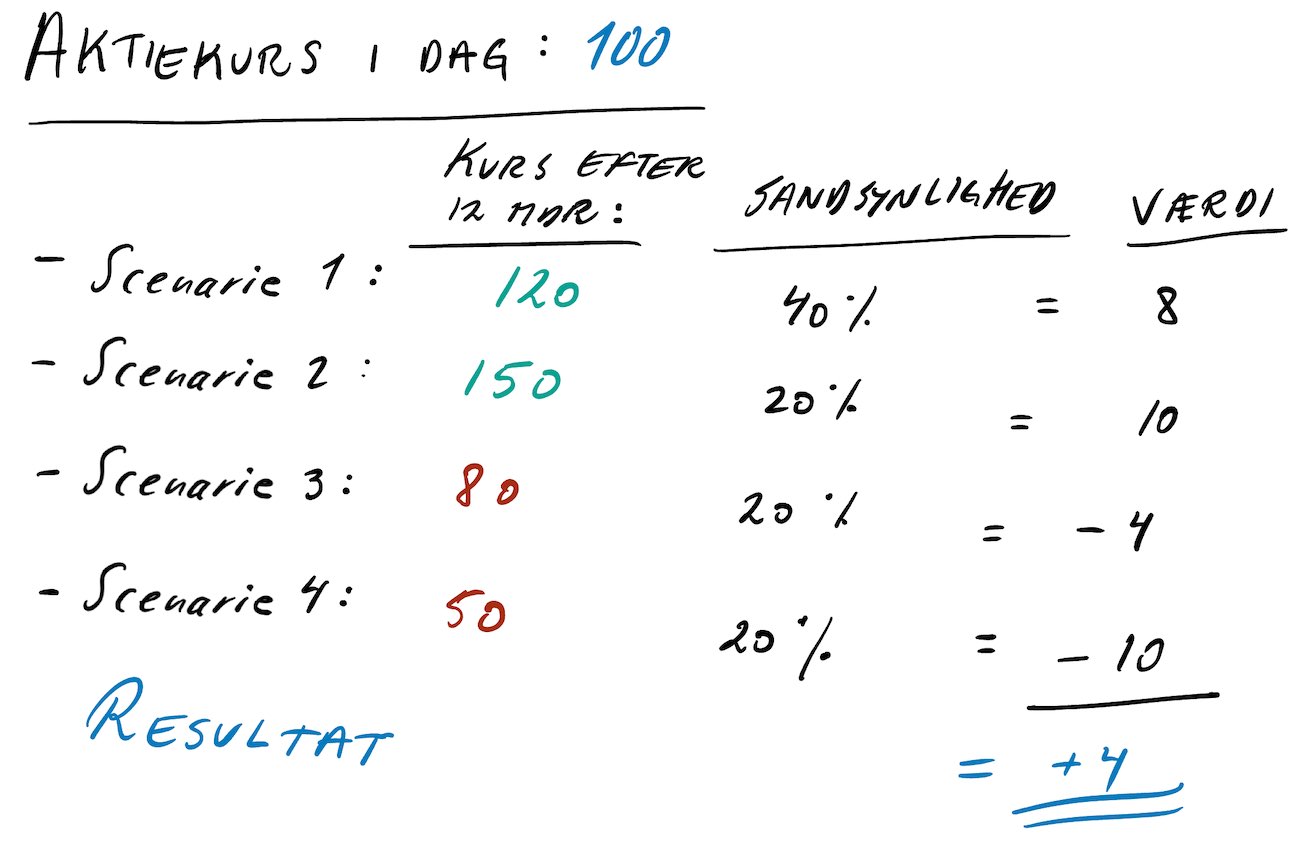
In practice, the expected value can be calculated by multiplying the expected return of a given scenario by the probability of that scenario materializing. To get a more realistic model, it’s best to do this with 3-4 scenarios and then add them together. If it’s a positive number, there is more upside than downside.
An example may help to illustrate the concept:
A picture is worth a thousand words
True to the headline, I will try to keep the explanation of the last model short.
The graph is based on the price development of the US stock market from 1926 to 2006, where the average return was around 10% and the standard deviation around 20%.
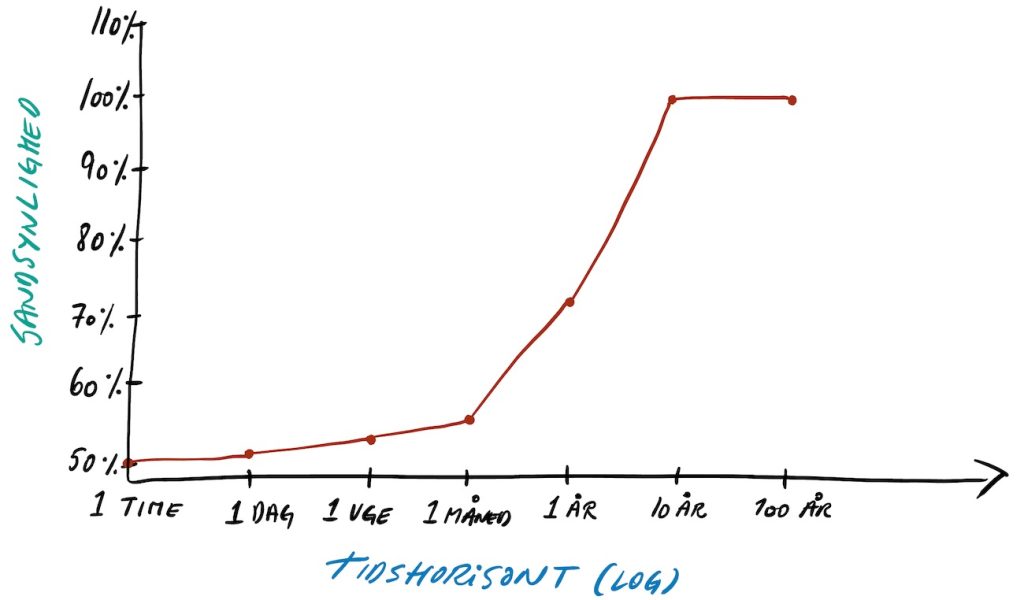
The horizontal axis shows time and the vertical axis the probability of a positive return. Initially, the outcome is largely random (50%) but after just one year, the probability has increased to 73% and after ten years, the probability of a positive return is 99.9%. Fairly acceptable odds all things considered (!).
The simple takeaway: The probability of a positive return increases significantly over time.