The stock market in 2023
The stock market has always had good and bad times. As much as we’d like to forget the bad ones when things are going well, they happen at regular intervals. Something we were reminded of in 2022 after a very strong rebound in equities following the Corona pandemic. In fact, the fall in equity markets was so large in 2022 that it ranks in the top 10 worst real returns in the last 100 years, after inflation is factored in.
Looking at the bond market, it wasn’t much better and the US saw its worst year ever after inflation. So if you have a mix of stocks and bonds in your portfolio, you’re not alone in feeling that it’s been a difficult year.
To put stock market fluctuations into perspective, below we will look at the development of the global economy over the past two years (don’t worry, it’s short). Next, we dive into three main indicators that can help us assess where the stock market is right now. Finally, I’ll conclude with my recommendation on how you should allocate your funds in the current market.
A brief look back
The last time I took the temperature of the markets was in Q2 2021. Back then, the Corona pandemic filled the front pages of newspapers and captured everyone’s attention. Fortunately, this is no longer the case. Well… We can’t relax and enjoy a quiet period anyway. At least not when it comes to the economy and stock markets. High inflation, interest rate hikes, war and fears of economic recession have stolen the newspaper headlines.
National banks are no longer helping businesses and households with low interest rates and massive bailouts. Both interest rates and inflation are high, so there is effectively less money to buy goods and services. At the same time, the news is dominated by fears of recession, which in itself puts a damper on consumption and investment. In addition, there is uncertainty due to the geopolitical situation in Ukraine and between the US and China.
The situation can be summarized as follows:
Q2 2021 |
Q1 2023 |
|
Inflation |
Hurtigt stigende inflation: 4-5%. |
Inflationen toppede medio 2022 på et niveau ikke er set i årtier (7-9%). Faldet en smule over de seneste måneder, men stadig på et højt niveau. Undtagelsen er Kina. |
Rente |
Renteniveauet er ekstremt lavt globalt (negative renter i mange lande). |
Renteniveauet er øget betragteligt - vi skal +15 år tilbage for at finde tilsvarende niveauer. Særligt i USA, men også EU. Undtagelsen er Japan. |
Stimulering af økonomierne |
Mange regeringer har stimuleret økonomierne massivt under og efter covid-19. |
Covid-pakkerne er fjernet og der er meget begrænset stimulering - forventning om stramninger i USA og EU. |
Jobmarkedet |
Historisk lav arbejdsløshed globalt. |
Trods rentestigninger fortsat en historisk lav arbejdsløshed globalt |
Private husholdninger |
Mange private har udskudt køb af diverse produkter og services (tænk middage, fester og rejser) og er først for alvor begyndt at bruge flere penge, efter flere lande er begyndt at åbne op. |
Høj inflation kombineret med en frygt for recession medfører lavere forbrug. Kan ses i regnskabssæsonen for Q4 2022, hvor fx Apple's omsætning og indtjening er faldende. |
Geopolitisk |
Øgede spændinger og på nogle fronter handelskrig mellem USA og Kina. |
Rusland fører krig i Ukraine. Fortsatte spændinger mellem USA og Kina. |
In other words, the economic situation has changed significantly over the last two years. These factors – and many more – led to global stock markets falling by almost 20% in 2022.
Developments in global stock markets
After the falls in 2022, you may have noticed that many of the major indices have seen nice increases over the past few months – around 10% for Danish, European and US stocks. The big outlier is Chinese stocks, which have seen an increase of almost 40% in the same period.
If we zoom out a little, the price development tells a different story. Over five years, the Chinese index has fallen by almost 30%, whereas the Danish and US indices have both risen over 56%. The European index is slightly lower with an increase of 23%.
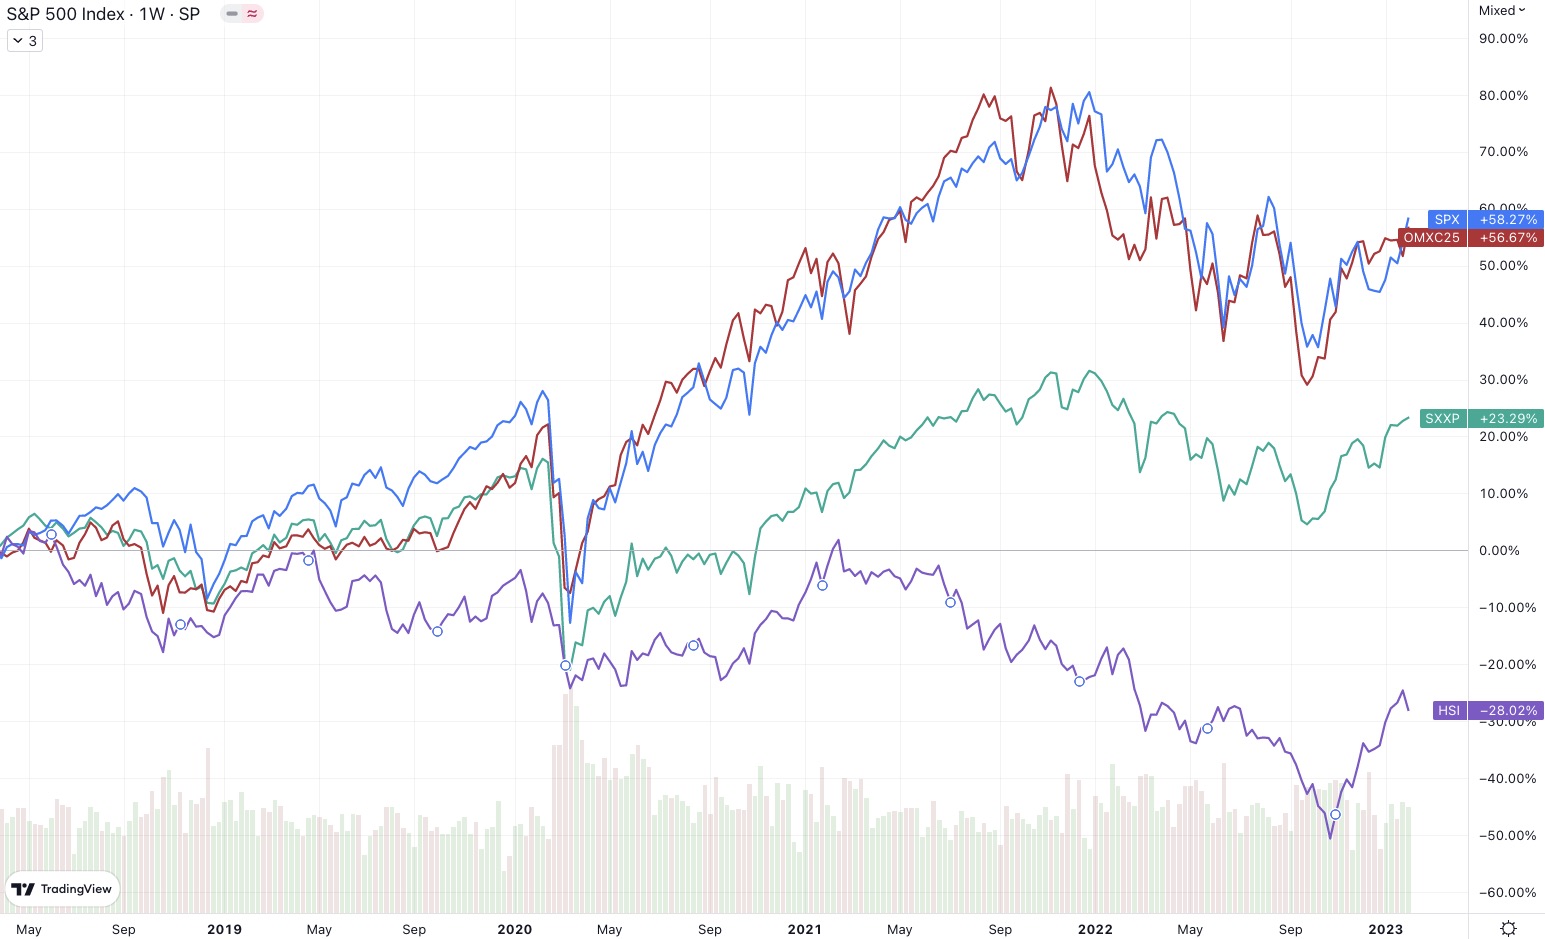
OMXC25: OMX Copenhagen C25 SPX: Standard and Poor’s 500 SXXP: STOXX Europe 600 HSI: Hang Seng (Hong Kong) 60 index
In other words, despite the massive declines in 2022, the Danish and US markets have returned over 11% annually for the past five years. This is more than acceptable. What does that mean when we look ahead? Let’s look at the indicators.
Fortune tellers with crystal balls
As is often the case when trying to look into the future, there are no simple answers. My own view is basically that trying to predict where the markets will be in 6 or 12 months is a waste of time. It doesn’t help that we’re constantly bombarded with sensationalized news from “market gurus” who gleefully tell us where the market is headed – coupled with an overwhelming amount of data to back up these predictions. Typical in both up and down direction (at the same time!).
While I (unfortunately) can’t predict the future, it can still be valuable to make a rational assessment of where the market stands today. To do this, we look at three recognized and fundamental indicators that can be used to assess the current price level of the market. The first two put the current market in a historical context, while the third is based on forward-looking estimates.
- Buffet indicators (market-cap versus gross domestic product)
- The Shiller CAPE ratio (stock market versus corporate earnings)
- Damodaran Expected Market Return (fundamental valuation of the stock market)
1. the Buffett Indicator - Market-cap versus the economy
One of the best indicators to assess whether the current stock market is expensive or cheap in a historical context is the so-called ‘Market cap to Gross Domestic Product’. Back in 2001, Warren Buffett stated in an interview with Fortune Magazine that“it is probably the best single measure of where valuations stand at any given moment.” Hence the name “The Buffett Indicator”.
It is calculated by taking the total market value of the US stock market (the Federal Reserve’s “market value of equities outstanding”) compared to the US gross domestic product (GDP).
The reason I focus on the US market is because it very often sets the tone for the rest of the world – especially when it comes to the stock market. In addition, US companies make up over half of the total value of all listed companies in the world. If you own a global index or have a portfolio that roughly matches the distribution of the world market, the price of the US market is therefore very indicative of where we stand in terms of price. the historical levels. Also for Danish investors.
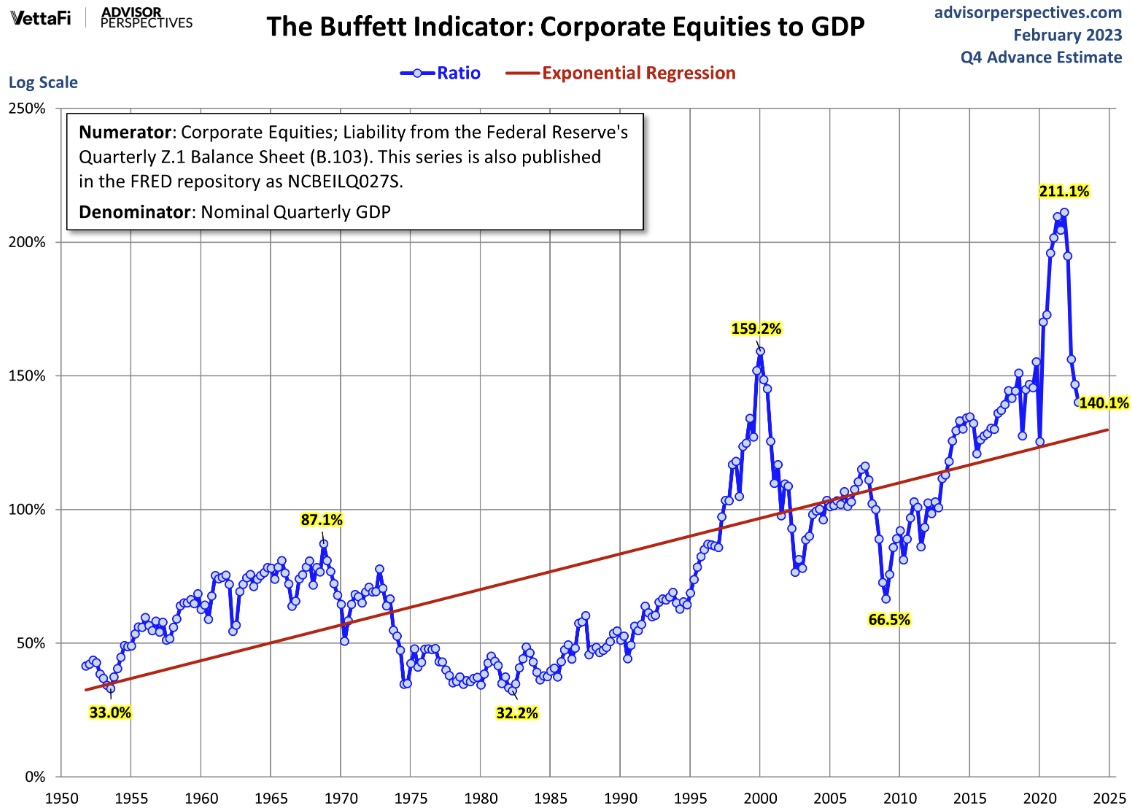
Looking at the graph, at the beginning of February 2023 we are still at a relatively high level in a historical context (the blue line). However, we can see quite a significant drop compared to January 2022, when the market was above 2x GDP and at its highest level since the 1950s. Today, the US market is about 40% above average.
If we reflect on it for a moment, it’s not really that surprising. The market was at an all-time high at the start of 2021, while economies around the world – including the US – experienced significant declines in their gross domestic products due to Covid-19. As we saw earlier, the S&P500 has fallen almost 20% since its peak, while US GDP has risen around 4% after inflation.
My main objection to the Buffett indicator is that it trends upwards over time. In other words, it seems that we as investors are willing to pay a higher price for shares over time. To better accommodate this trend, I have chosen to show the graph with the red trend line. When correcting for the general trend, the US market is fairly fairly priced, but still about 10% above (more expensive) than its historical level.
2. Shiller CAPE: Stock Market Versus Corporate Earnings
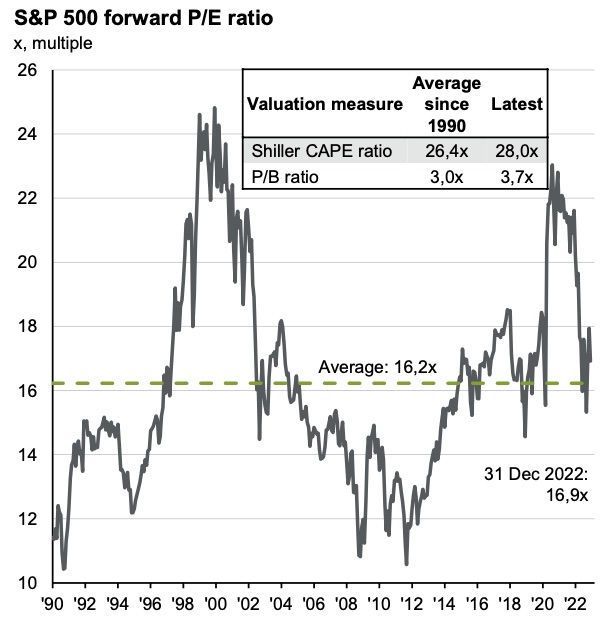
If we look at the companies’ earnings, we see that earnings relative to the current US stock market (S&P 500) have a Price-to-Earnings ratio of 16.9 compared to an average of 16.2 over the last +30 years. It should be noted here that the current level of 16.9 is forward-looking – i.e. the analysts’ estimate of the coming 12 months’ earnings, thus factoring in the growth they see in the coming year.
The challenge with P/E ratios, however, is that corporate earnings are highly volatile over time due to the general cyclical fluctuations in the economy. This can be seen quite clearly in the graphs below. To meet this challenge, Professor Robert Shiller of Yale has developed a ‘cyclically adjusted’ P/E ratio (CAPE for short) that uses a 10-year average.
If we instead look at the CAPE ratio, it shows a current level of 28.0 versus a historical average of 26.4. In this context, the US market is also slightly above (more expensive) than the historical average.
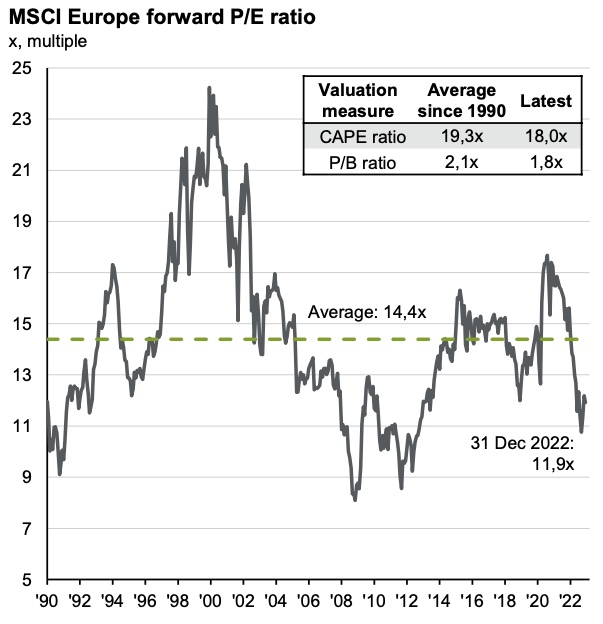
If we look at the figures for the European market (MSCI Europe), it shows a P/E average over the last 30 years of 14.4. By the end of 2022, the P/E is down to 11.9 – significantly lower than the normal level. If we adjust for the ups and downs of the economy using CAPE, we see that today’s figure is 18.0 versus an average of 19.3, again below the historical norm.
Looking at the global figures (MSCI World), the P/E is 15.0, which is slightly below the historical average of 16.3. Unsurprisingly, this matches the underperformance of Europe, Asia and Emerging Markets in recent years.
3. Damodaran Expected market return
An interesting and fundamentally different approach to assessing whether a market is over- or undervalued is Professor Aswath Damoderan’s Implied Expected Returns model. Instead of using historical figures as a reference, he uses market expectations, and although they can also be influenced by what has happened historically, they provide a more accurate estimation. At the same time, the model addresses some of the challenges of looking at the market in relation to history, particularly which period to choose as a basis for comparison and how to calculate the average (arithmetic or geometric).
The model is based on a calculation of the so-called“Equity Risk Premium” (ERP for short), which is the additional return the market requires for owning shares instead of the ‘risk-free rate’. The safest security the market offers is the 10-year US Treasury bond (called a ‘T-bond’ in the US) and although the price of the bond can fluctuate over time, the central bank’s ability to print money and thereby cover its creditors – all of us investors – means that the bond is used as a proxy for the ‘risk-free rate’. The T-bond interest rate at the beginning of February 2023 is 3.6%. SKAT in Denmark uses the 10-year government bond as the risk-free interest rate.
To calculate the market’s expected (implied) return, analysts’ estimates of earnings, cash flow growth and dividend/share buybacks in 2023 and 2024 are used. The figures give an expected growth in earnings of 6.4% for the next 5 years and 3.88% thereafter, which is the risk-free rate. As a baseline, S&P500 company data for the last 12 months is used. I’ll spare you the other details of the calculation(which can be seen here), but the result shows that the market expects a total return of 9.82% in 2023 for the S&P500.
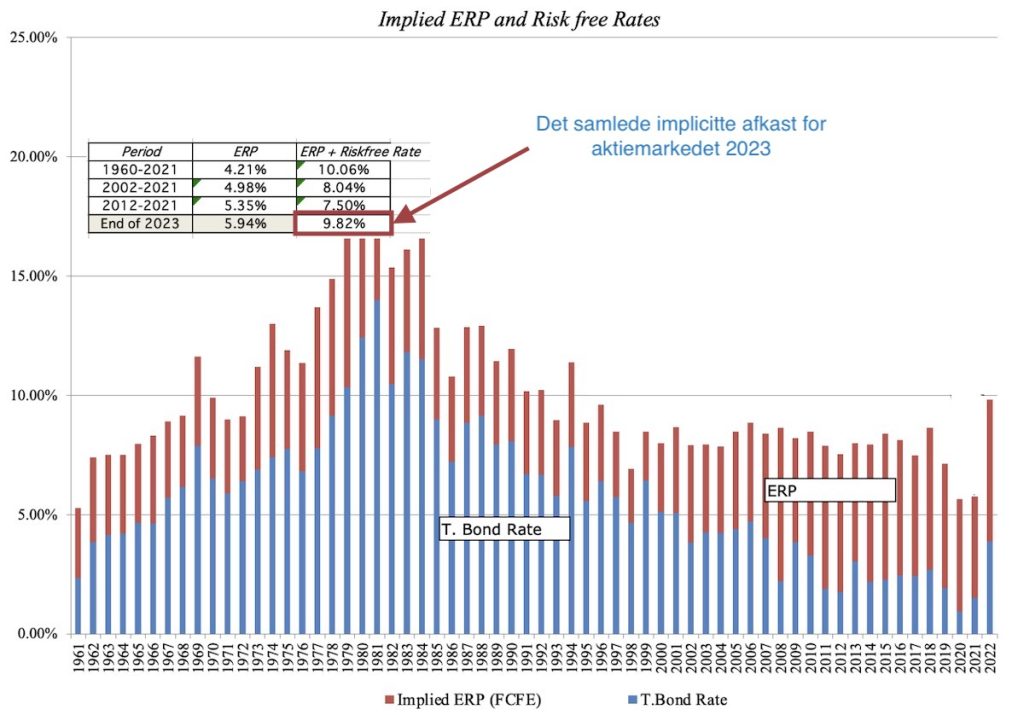
As the table above shows, it is an Enterprise Risk Premium (ERP) at the top of the historical spectrum. Even more interestingly, the expected return is now at its highest level since 1995.
Does this mean that the S&P 500 is over- or undervalued? If we look at Damodaran’s Discounted-Cash-Flow model (DCF) for the index, we can see that it is 3.3% below fair value based on market expectations for the next two years and base rates for the last 12 months.
For comparison, the Equity Risk Premium in Denmark was around 6.5% according to the latest figures from Danmarks Nationalbank from September 2022. Slightly higher than the expected ERP in the US, but basically on par.

Summarizing
So what should you do with these considerations? Basically, rather than following my (or anyone else’s) recommendations, you should use the above input to find your own footing. Hopefully the above and similar sources can help you along the way.
My own conclusion is that as a long-term investor (+10 year time horizon), I should have a fairly normal allocation of my funds with a slight overweight towards equities. If you normally have 70% in stocks, consider going up to 75% and if the market drops 10-20% increase to 80%. In addition, it may make sense to overweight the European market, Emerging Markets and China, all three of which are reasonably priced in a historical perspective.
If you haven’t yet determined the allocation of your funds between the different asset classes, I would recommend starting with that first(see here).
If you have a larger lump sum that you want to invest, I would recommend buying into the market over a slightly shorter period than usual, e.g. 20% of the amount each month. Similarly, with a slight overweight towards Europe, Emerging Markets and China.
Remember that the indicators are not useful as short-term signals of where the market is heading. Periods of very high or low prices can last for many years. The indicators can help us assess what we can reasonably expect in terms of returns over a long time horizon (+5 years).