Heading for the beach
The stock market has always had periods of high and low performance. As much as we’d like to forget the bad ones when things are going well – as they are at the moment – they happen at regular intervals. Something we were reminded of in 2020 following the Corona pandemic and again in 2022 with the rapidly increasing inflation and interest rates.
While inflation dropped in 2023 and has continued to do so in 2024, the US and European central banks are still grappling with elevated price pressures. Interest rates remain high, with the US Fed signaling a slower pace of cuts compared to previous expectations. In June of 2024, ECB did its first rate cut of 0,25%, but expectation of further cuts is currently three in 2024 (0,75% in total).
In China, inflation has been much lower at 1-2%, but the economy faces challenges from its property market downturn. Bundled with a historic low consumer confidence, this poses risks to both the Chinese and global economy. Foreign investments continue to leave the country based on geopolitical risk and the troubles mounting in its property sector.
To put the market fluctuations into perspective, we dive into three main indicators that can help us assess whether the current markets are expensive or cheap in a historical context. Finally, I’ll conclude with a few recommendation on how you should allocate your funds in the current market. First, let’s look at where we stand.

Developments in global stock markets
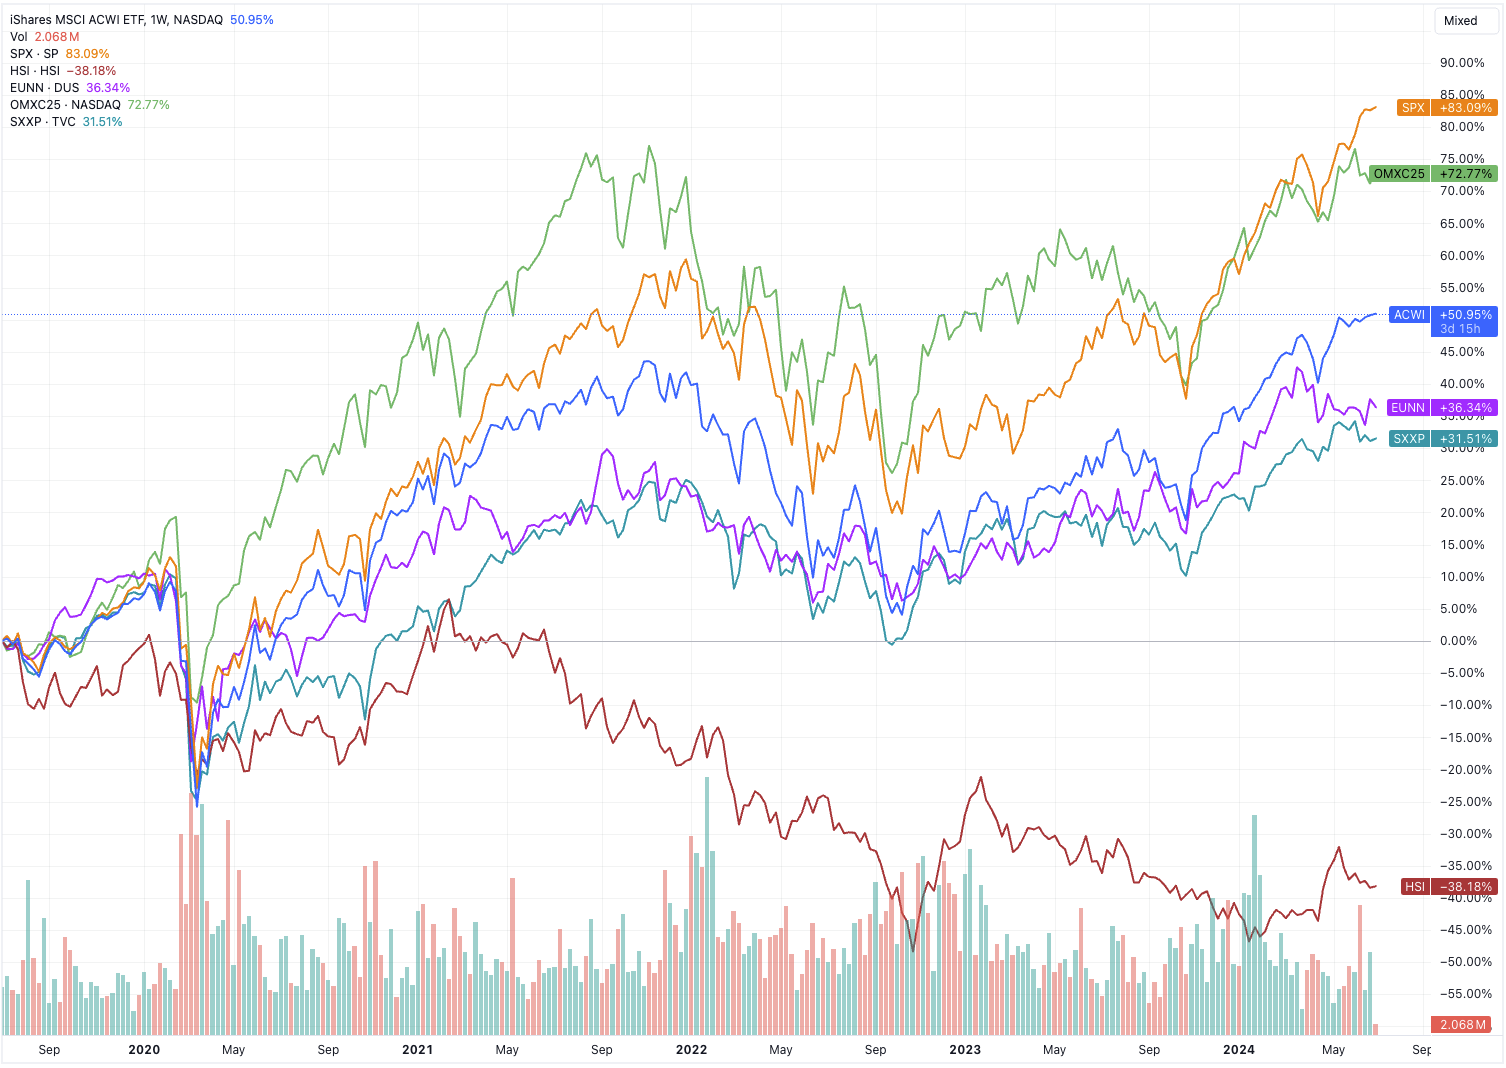
After experiencing a significant drop during 2023, many markets rebounded in Q4 2023 and have rallied throughout the first half of 2024 with most major indexes up 5-15% this year. The Danish and US indices have both risen over 70% and the global stock market (the ACWI index) is up +50% over the last five years.
The big outlier continues to be the Chinese stock market. Over same five years, the Chinese market has fallen by almost 40%.
With the current market trends in mind, lets dive into the indicators.
1. the Buffett Indicator - Market-cap versus the economy
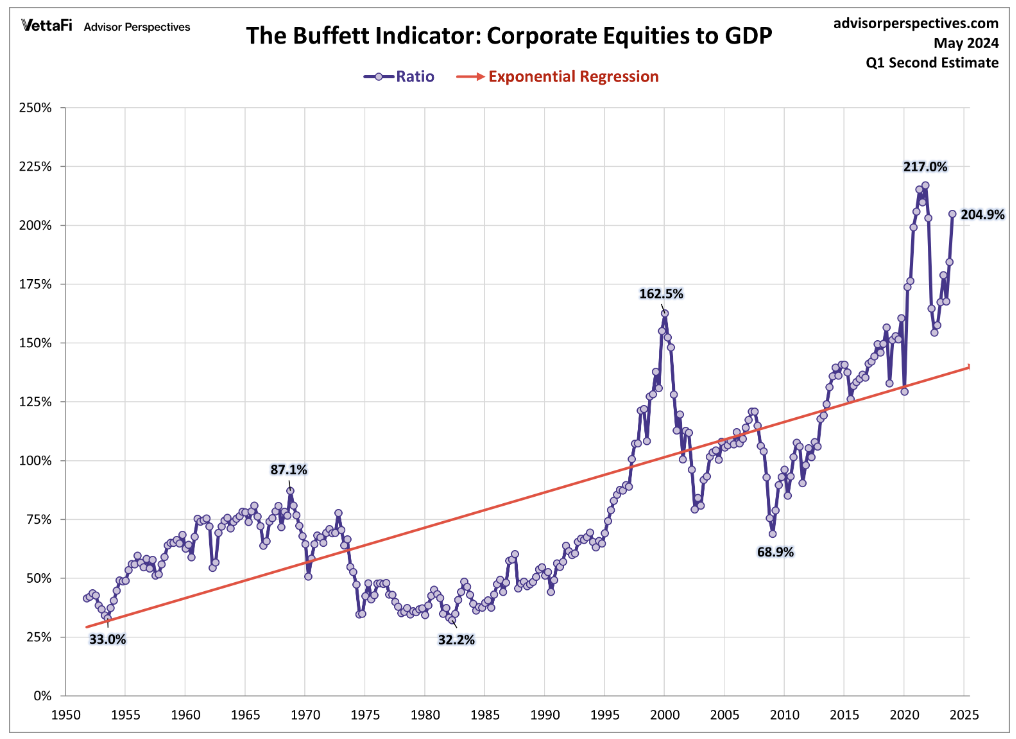
One of the best indicators to assess whether the current stock market is expensive or cheap in a historical context is the so-called ‘Market cap to Gross Domestic Product’. Back in 2001, Warren Buffett stated in an interview with Fortune Magazine that ‘it is probably the best single measure of where valuations stand at any given moment.’ Hence the name ‘The Buffett Indicator’. It is calculated by taking the total market value of the stock market – in this case the US Federal Reserve’s ‘Market value of equities outstanding’ – compared to the US Gross Domestic Product (GDP).
The main challenge with the indicator is that it trends upwards over time, ie. investors has shown a willingness to pay a higher price for equities over time. To better accommodate for this, a red trend line has been used instead of an average.
At the end of May 2024, we are once again back at very high level in a historical context (the blue line). The market currently stands above ~2x GDP and at its second highest level since 1950. In statistical terms, prices are currently 1.6 standard deviation above the red trend line or roughly ~50% above the last 75 years. Even when correcting for willingness to pay higher prices (the red line), the US stock market remains materially overprized compared to its historic level.
The market has clearly reacted positively to the strong US economy with falling inflation, low unemployment rates and expectations of lower interest rates. However, if the economy does turn more negative and interest rates stay above expected levels, the current high market prices make a significant market drop possible (think >20%). The when and why, I will leave to the colleagues with crystal balls.
2. Shiller CAPE: Stock Market Versus Corporate Earnings
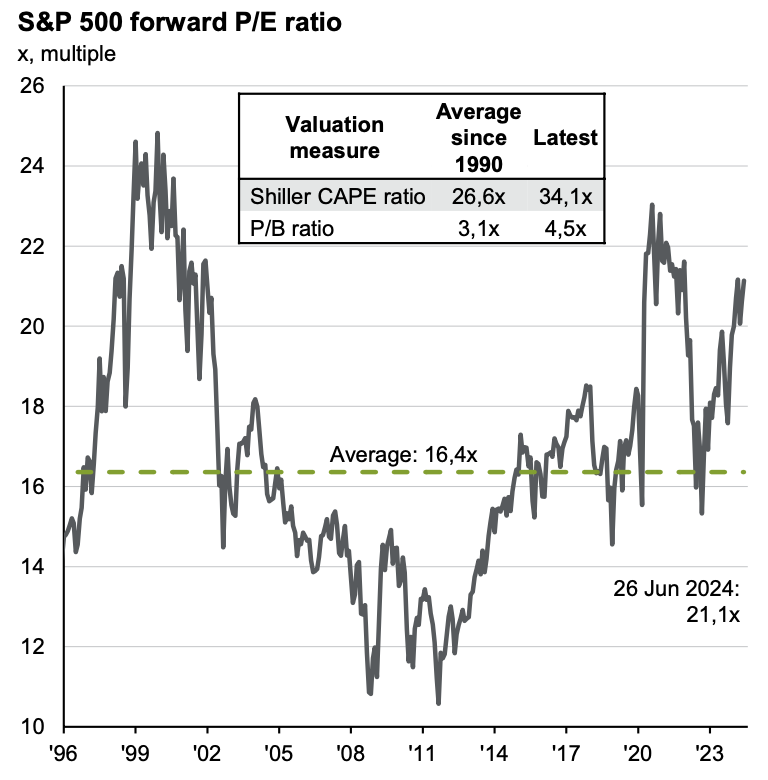
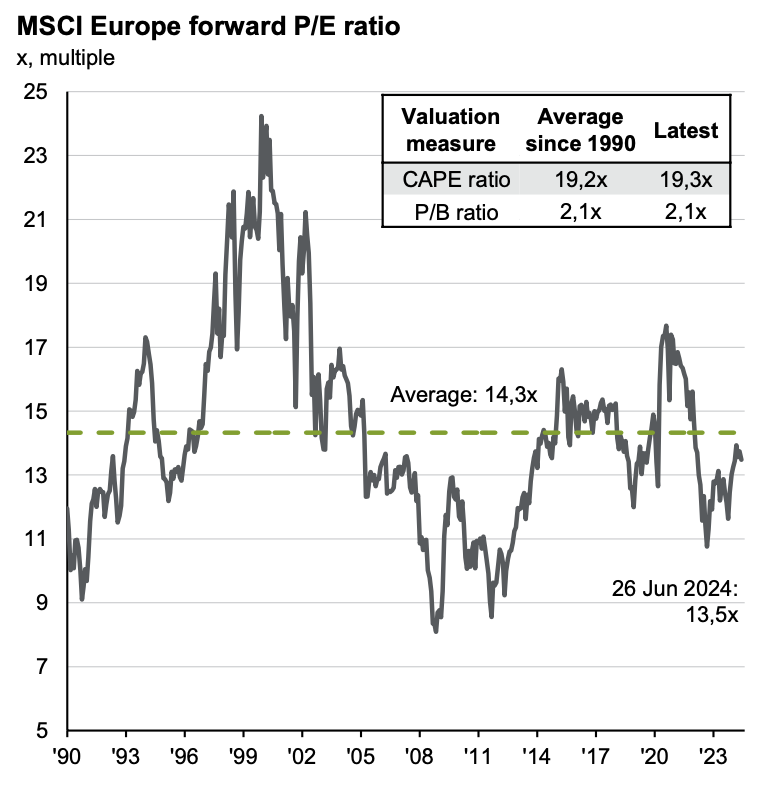
If we turn our attention the companies’ earnings, we see that the US stock market (S&P 500) has a Price-to-Earnings ratio of 21.1x, materially above it’s average of 16.4x since 1996. It should be noted that the current level of 21.1x is forward-looking – i.e. is based on analysts’ estimated earnings for the next 12 months. If we look at the figures for the European market (MSCI Europe), it shows an average P/E over the last 30 years of 14.3x. By the end of June 2024, the forward P/E is down to 13.5x – somewhat lower than the average level.
The challenge with P/E ratios, however, is that corporate earnings are highly volatile over time due to the cyclical fluctuations in the economy. To meet this challenge, Professor Robert Shiller of Yale has developed a ‘Cyclically Adjusted P/E’ ratio (CAPE for short) that uses a 10-year average.
In the US, the CAPE currently stands at 34.1x versus a historical average since 1990 of 26.6x making it significantly more expensive than the historical average. In Europe we see that today’s CAPE is 19.3x versus an average of 19.2, making it neither expensive nor cheap.
3. Damodaran Expected market return
A different approach to assess a broad stock market, is NYU professor Aswath Damodaran’s Implied Expected Returns model. Instead of using historic data, Damodaran builds a cash flow model based on analyst’s market expectations, and although they can be influenced by what has happened historically, they provide a more forward-looking estimate.
The model is based on a calculation of the so-called “Equity Risk Premium” (ERP), which is the additional return the market requires for owning shares in addition to the ‘risk-free rate’ offers by the 10-year government bond (called a ‘T-bond’ in the US). At the beginning of July 2024, the US T-bond stands at 4.4%
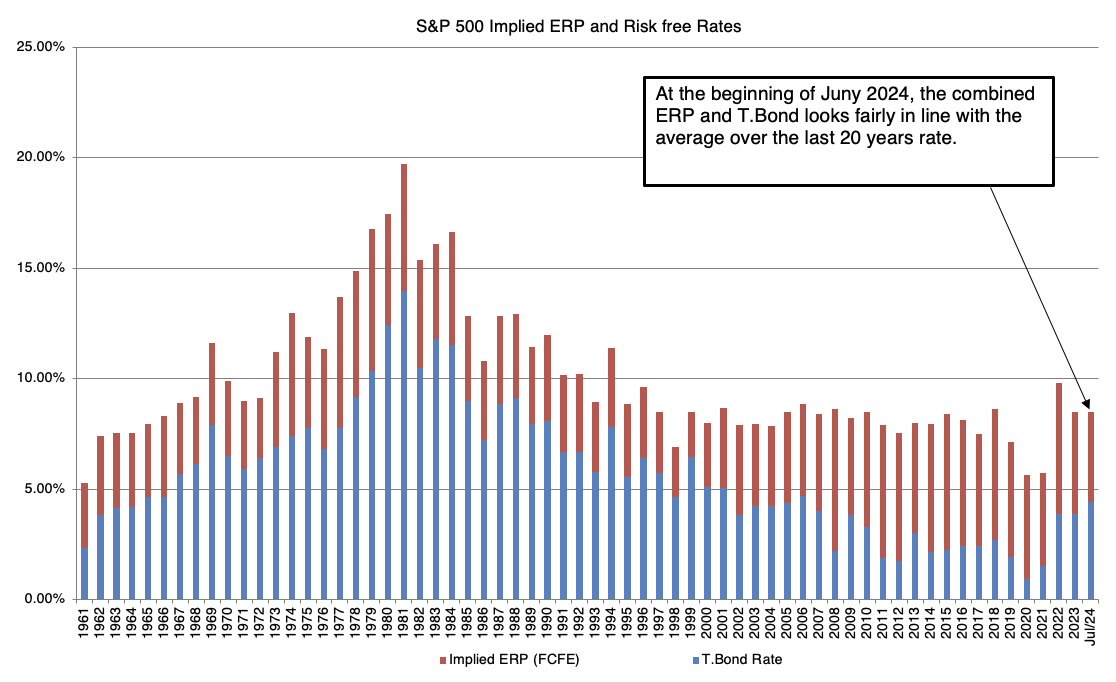
The market’s implied expected return is calculated by building a 5-year Discounted Cash Flow model with the last 12 months earnings as the starting point and adding analysts’ estimates of earnings and cash flow growth plus dividend/share buybacks. I’ll spare you the details of the calculation (which can be seen in this Damodaran blogpost). The results show us that the market implicitly expects a total return of 8.51% as of July 2024 for the S&P500.
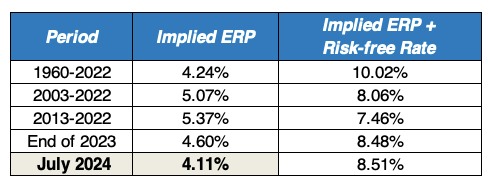
If we subtract the current risk-free rate of 4.4%, we see that the implied ERP is currently 4.11% which is actuarially below the historical levels for last 10 and 20 year periods.
Summarizing
- From a historic perspective (1 and 2 above), the US market is materially above the normal level. Bringing in Damodaran’s forward looking valuation of the US market, things get a bit more blurry. Looking purely at estimates of forward earnings brings us to an expected return of around 8.5% which is in the ball park of historic performance. What this also tells us, is that the market is fairly optimistic about the growth and robustness of the US market. If cracks in the US economy materialize and earnings disappoint, there is room on the downside.
- With the global equity market having appreciated around 10% per year over the last five years, this represent a high but not extreme return in historic perspective. Hence, a long-term investor with global exposure should have a fairly normal allocation of his or her funds. If you normally have 70% in stocks, you should probably leave it at that.
- Although there are parts of the market that is currently above historic level – especially large cap US stocks – other parts of the market is a different story, e.g. European, UK and and Chinese stocks, all three of which are reasonably priced if not cheap in a historic context. If you are putting more funds to work in the market, it might be worth allocating towards these geographies. They may also be interesting hunting ground for bargain hunters.
As always, rather than following my (or anyone else’s) recommendations, you should use the above input to find your own footing. And remember, the indicators are not useful as short-term signals of where the market is heading. Periods of very high or low prices can last for many years. But the indicators can help us assess where we currently are, and what we can reasonably expect in terms of returns over a long time horizon.
Fortune tellers with crystal balls
As is often the case when trying to look into the future, there are no simple answers. My own view is basically that trying to predict where the markets will be in 6 or 12 months is a waste of time. It doesn’t help that we’re constantly bombarded with sensationalized news from “market gurus” who gleefully tell us where the market is headed – coupled with an overwhelming amount of data to back up these predictions. Typical in both up and down direction (at the same time!).
While I (unfortunately) can’t predict the future, it can be valuable to make a rational assessment of where the market currently stands. To do this, we look at three indicators that can be used to assess the current price level of the market.
- Buffet indicators (market-cap versus gross domestic product)
- The Shiller CAPE ratio (stock market versus corporate earnings)
- Damodaran Expected Market Return (fundamental valuation of the stock market)