New and improved portfolios
It took some legwork, but all portfolios are now updated in a consistent and expanded format. This means that you can now gain insight into the buying and selling of several Danish investors, including Claus Wiinblad – ATP Danske Aktier, Kurt Kara – Maj Invest Value Aktier and Kasper Lorenzen – PFA Danske Aktier.

Unique insight into Danish portfolios
As always, the portfolios provide an overview of which companies investors have bought or sold. However, for many of the Danish investors, the number of shares is not published and it can therefore be difficult to compare two periods, as the difference can be due to an actual purchase/sale or simply a price increase/decrease. Or a combination of the two.
To counter this, the number of shares is now calculated for each period based on the companies’ half-year and annual reports. This provides a unique insight into the development over time for Danish investors.
Increased insight into price development
Another interesting question is what price investors have been willing to buy or sell a company for. The challenge is that this is not made public – neither for Danish nor foreign investors. It is therefore not possible to give a clear-cut answer. On the other hand, we know the period in which investors have bought/sold a position and the price development during this period.
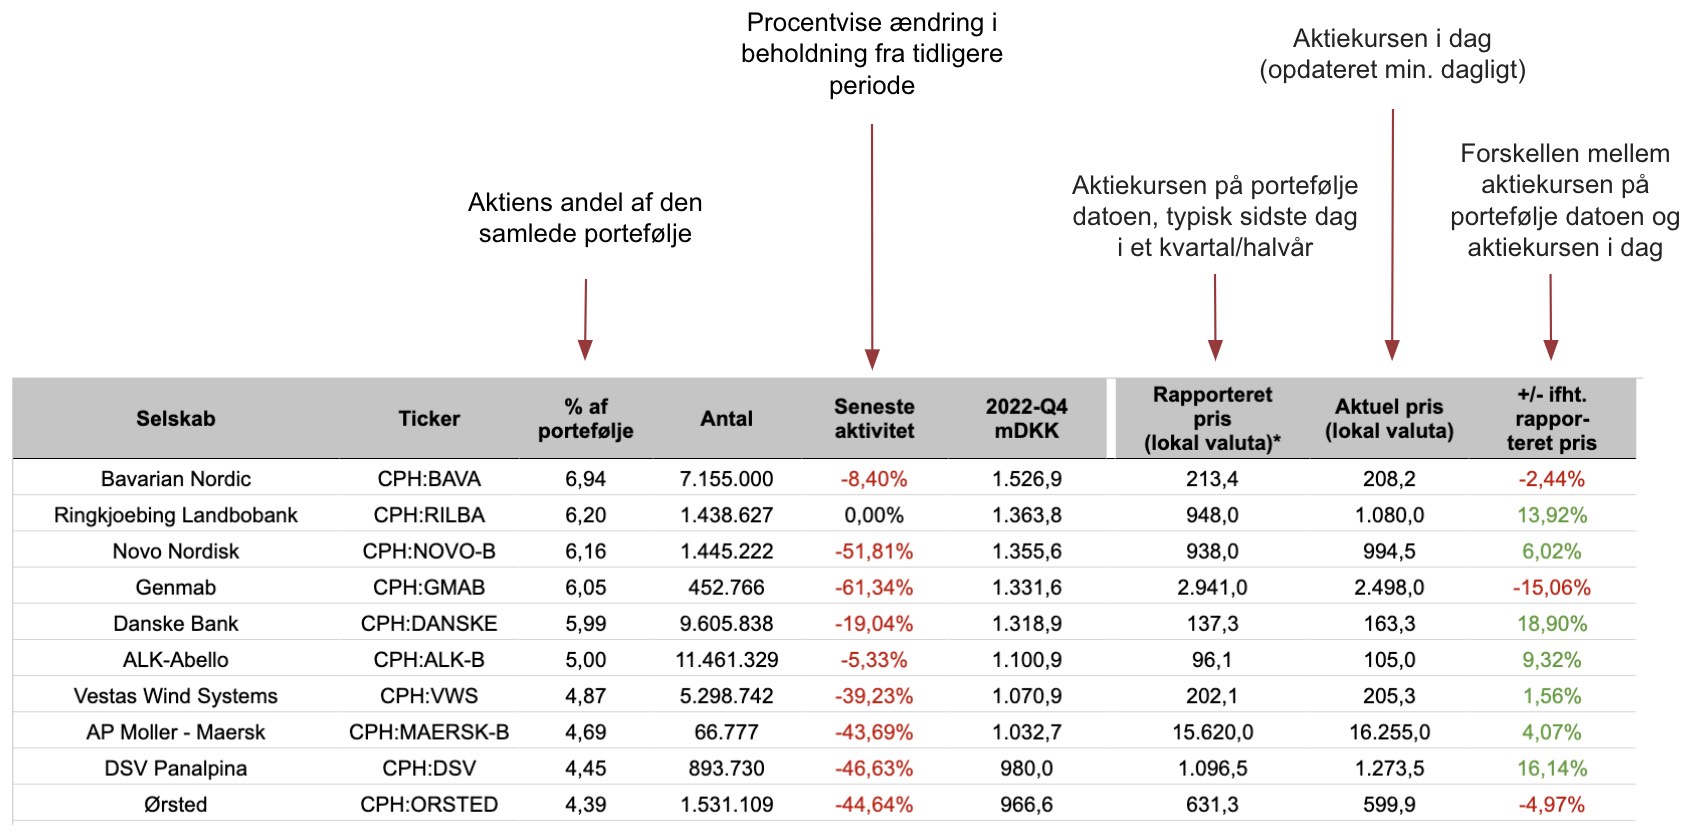
To get a consistent picture across all portfolios, the share price on the portfolio date is used. This ‘reported price‘ is the share price on the day the investor extracts their holdings for quarterly/half-yearly reporting. In practice, this would be the last calendar day of a quarter or half-year, e.g. 30/6 or 31/12. This ‘reported price’ is chosen because it is the last known price at which the stock is held in the portfolio.
To put this price in relation to the current share price, ‘current price’ columns have been added, which are automatically updated daily, as well as a column with the difference between the two, called ‘current price’.+/- compared to. reported price‘.
If you want a more nuanced picture of the price at which an investor has bought or sold a position, I recommend looking at the share price development over the last three or six months. We can’t know when in the period a given position was bought/sold, but at least we know the highest and lowest price in the period.
Understand your portfolios
The improvements have resulted in the portfolio layout, an example of which you can see below. Above the arrows are brief descriptions of what the most important columns mean.

You can see all the portfolios here.


