It didn’t take long for the corona pandemic to take hold in Western countries before stock markets fell by ~35%. It always seems violent when the market experiences big drops. And this was a particularly rapid drop – from top to bottom in less than a month. But part of the story is that the markets had been rising for a very long time prior to this. The leading US S&P 500 index had been in bull territory continuously for no less than 131 months and had seen a 401% increase since the financial crisis.
At the start of October 2020, the US market, as measured by the S&P 500, is around where it all started – close to the all-time high from February 19. The European index, Euro Stoxx 50, is not as high at around 3,200 versus 3,800 in February. The macro situation from a helicopter perspective looks like this:
On the positive side:
- Central banks in Europe and the US have flooded the economies with liquidity and various forms of financial aid. Examples from Denmark are DKK 1,000 for people on transfer payments, payment of frozen holiday pay, assistance packages for companies, etc.
- Interest rates have been significantly lowered in the US and kept very low (negative) in Europe. This has led to increased global demand in the stock market, resulting in higher prices. A repetition of the mantra that ‘there is no alternative’ to stocks.
- The European and US Federal Reserve seem willing to provide stimulus relatively far into the future
On the negative side:
- Western economies have experienced the largest quarterly decline in history.
- The Corona pandemic is still not under control in Denmark, Europe or the US
- A resurgence in the fall and through the winter can make it difficult to reopen the economy or even cause a widespread shutdown.
In other words: There are two powerful forces fighting in opposite directions. On the one hand, central banks and governments, and on the other, a global pandemic and recession. But which side will win?
As is often the case when trying to look into the future, there is no simple answer. But if we can’t predict the future, we can at least try to figure out where we are today. To that end, we will look at three recognized indicators that can be used to assess the market’s price level.
1. The Buffet indicator - Willshire to US GDP
Looking at the global stock market, there’s no getting around the fact that the US remains the biggest player and often sets the tone for the rest of the world. In fact, by 2020, the US will account for approximately 54% of the total value of listed companies in the world. If you own a global index or have a portfolio that roughly matches the distribution of the world market, the price of the US market is therefore very indicative of where we stand in terms of prices. the historical levels.
One of the indicators I have always been fond of is the so-called “Buffet indicator”. Back in 2001, Warren Buffett stated in an interview with Fortune Magazine that“it is probably the best single measure of where valuations stand at any given moment.” The version I find most informative is shown in the graph below. In the counter is the Wilshire 5000, which is an index of the 5000 largest companies in the US. In the denominator is the US Gross National Product (GNP), which is the total revenue of all US citizens (regardless of where they reside).
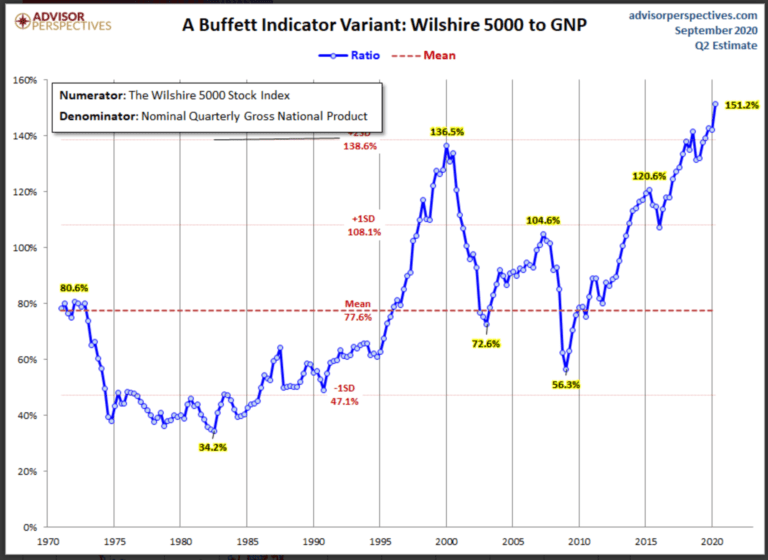
As the graph shows, at the end of September 2020, we are at the highest level in the last 50 years. If we reflect on this for a moment, it’s not really that surprising. As mentioned, the market is close to an all-time high again, while economies around the world – and certainly in the US – have seen quite significant declines in their gross domestic products. But it’s also worth noting that going into 2020, we were already well above the historical average (yes, that was it with the 131-month non-stop bull market).
Some may legitimately argue “well, the market generally rises 6-10% per year, so the graph can’t possibly be accurate”. It’s a fair point, but even when correcting for the market trend, we are today 64% above the corrected average over the last 50 years. Today’s price levels are only surpassed by the IT bubble in 1999, when we reached 96% above average
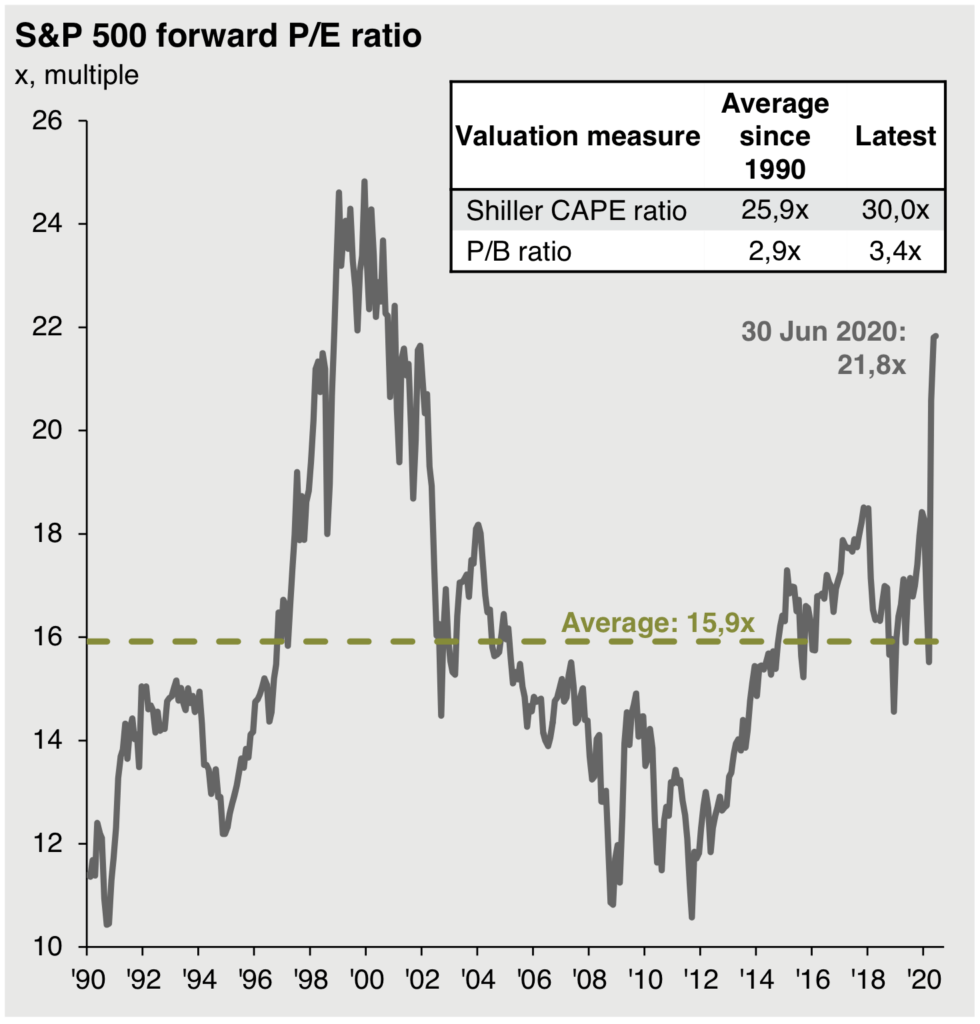
2. Shiller CAPE Ratio
Professor Robert Shiller of Yale University invented the Shiller PE ratio to measure market valuation. The standard Price/Earnings (P/E) ratio measures price to earnings. Shiller PE eliminates the fluctuations in the ratio caused by companies’ operating margins over the course of a business cycle. Hence the name “Cyclical Adjusted Price Earnings” ratio, or CAPE.
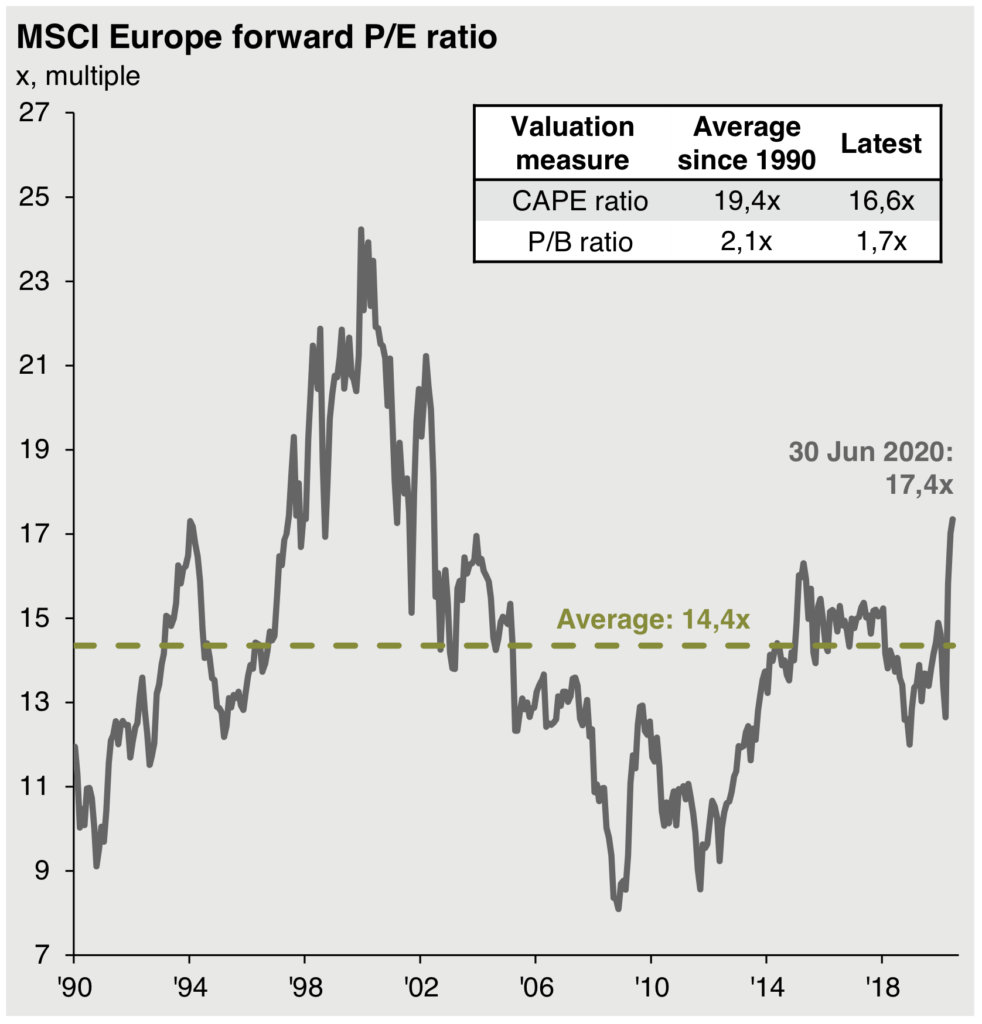
If we look at the CAPE ratio for the European market over the last 30 years, the average has been 19.4, but today it is lower at 16.6. The European market is thus cheaper than the historical average. The US market, on the other hand, is higher, with a CAPE of 30.0 versus an average of 25.9.
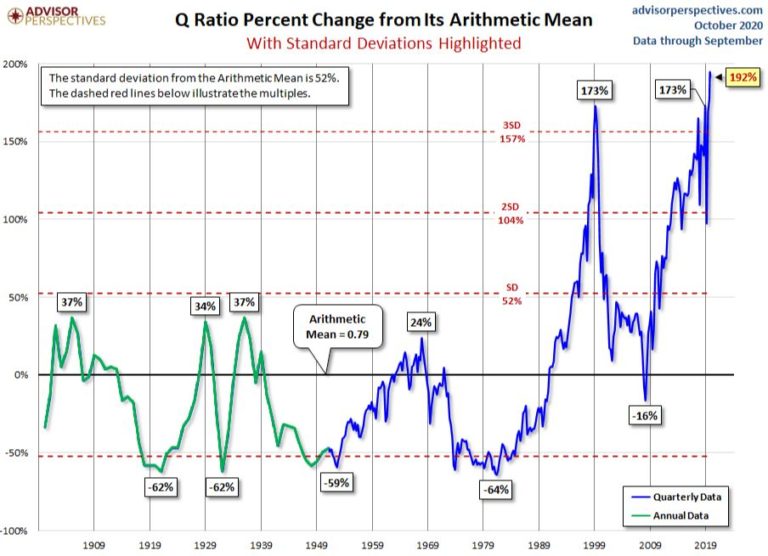
3. Tobin's Q Ratio
Tobin’s Q is a popular method for estimating the fair value of a specific company or the entire stock market, developed by Nobel Prize winner James Tobin. The Tobin ‘s Q ratio is calculated by taking a company’s market price and dividing it by the cost of replacing the company’s assets. Or to put it another way: If the ration is 1, it means that the cost of building a new company matches the market price. If the Q ratio is above 1, the company is overvalued, below 1 it is undervalued.
The graph below shows the development of Tobin’s Q for the US stock market (specifically the Vanguard total stock market / VTI). As you can see, we are currently at the highest level in the last 100 years. Even if we only look at the last 25 years, we are at a very high level
What can we expect going forward?
If we simulate what returns we can expect based on the current market situation and the companies’ expected earnings, the future does not look very bright. If we take the US market as an example, historical figures show that the next 10 years’ returns can be expected to be in the region of 0%. Plus/minus a few percent to cover uncertainty. That’s not exactly impressive when the US market has averaged a return of around 8% per year. The European and emerging markets, on the other hand, are relatively fairly priced in a historical context.
")
That said, remember that no one can predict the future (and if anyone tries, run far, far away). But it can tell us where we are in a historical perspective and what we can reasonably expect for the future in the long term (we’re talking years, not weeks or months). In this perspective, the above indicators show that we should be cautious.
Of course, this doesn’t mean you have to sell everything and go all cash. No one can know when the market will see a correction. But you should consider having 10% or 20% more cash or short-term bonds than usual. Should the markets take a turn for the worse, you have the funds to invest at more favorable prices. In addition, you should consider having a greater weighting in the European or emerging markets. Both are reasonably priced in historical perspective.